A memory dump is a file in which the contents of memory are stored. It helps software developers, forensics experts, etc. to analyze them and diagnose problems. In this post we’ll look at the memory dump of a system that was infected with R2D2 malware.
We’ll be using the following platform / software:
- A memory analyzer called volatility.
- A workstation — Ubuntu, SIFT, etc.
References: https://medium.com/@zemelusa/first-steps-to-volatile-memory-analysis-dcbd4d2d56a1

Volatility Installation
nikhilh@siftworkstation -> ~
$ sudo apt install volatility
Reading package lists… Done
…Unpacking volatility (2.5–1) …
dpkg: error processing archive /var/cache/apt/archives/volatility_2.5–1_all.deb ( — unpack):
trying to overwrite ‘/usr/lib/python2.7/dist-packages/volatility/fmtspec.py’, which is also in package python-volatility 2.6–1-xenial1
dpkg-deb: error: subprocess paste was killed by signal (Broken pipe)
Processing triggers for man-db (2.7.5–1) …
Errors were encountered while processing:
/var/cache/apt/archives/volatility_2.5–1_all.deb
E: Sub-process /usr/bin/dpkg returned an error code (1)
I hit an error, “dpkg: error processing archive /var/cache/apt/archives/volatility_2.5–1_all.deb ( — unpack):”. After some Googling, I came across the solution:
nikhilh@siftworkstation -> ~
$ sudo dpkg -i — force-overwrite /var/cache/apt/archives/volatility_2.5–1_all.deb
dpkg: error: dpkg status database is locked by another processnikhilh@siftworkstation -> ~
$ lsof /var/lib/dpkg/locknikhilh@siftworkstation -> ~
$ ps cax | grep PID
PID TTY STAT TIME COMMANDnikhilh@siftworkstation -> ~
$ sudo rm /var/lib/dpkg/locknikhilh@siftworkstation -> ~
$ sudo dpkg — configure -a
Setting up python-py (1.4.31–1) …
Setting up python-jdcal (1.0–1build1) …
…Setting up python-imaging (3.1.2–0ubuntu1.1) …
Processing triggers for libc-bin (2.23–0ubuntu10) …
/sbin/ldconfig.real: /usr/lib/libpff.so.1 is not a symbolic linknikhilh@siftworkstation -> ~
$ sudo dpkg -i — force-overwrite /var/cache/apt/archives/volatility_2.5–1_all.deb
(Reading database … 247046 files and directories currently installed.)
Preparing to unpack …/volatility_2.5–1_all.deb …
Unpacking volatility (2.5–1) …
dpkg: warning: overriding problem because — force enabled:
dpkg: warning: trying to overwrite ‘/usr/lib/python2.7/dist-packages/volatility/fmtspec.py’, which is also in package python-volatility 2.6–1-xenial1
dpkg: warning: overriding problem because — force enabled:…
dpkg: warning: overriding problem because — force enabled:
dpkg: warning: trying to overwrite ‘/usr/lib/python2.7/dist-packages/volatility/cache.py’, which is also in package python-volatility 2.6–1-xenial1
Setting up volatility (2.5–1) …
Processing triggers for man-db (2.7.5–1) …
Ensure that volatility is correctly installed.
nikhilh@siftworkstation -> ~
$ volatility
Volatility Foundation Volatility Framework 2.5
ERROR : volatility.debug : You must specify something to do (try -h)
What are the characteristics of the image?
To determine the characteristics of the memory dump, we will use the imageinfo plugin of volatility.
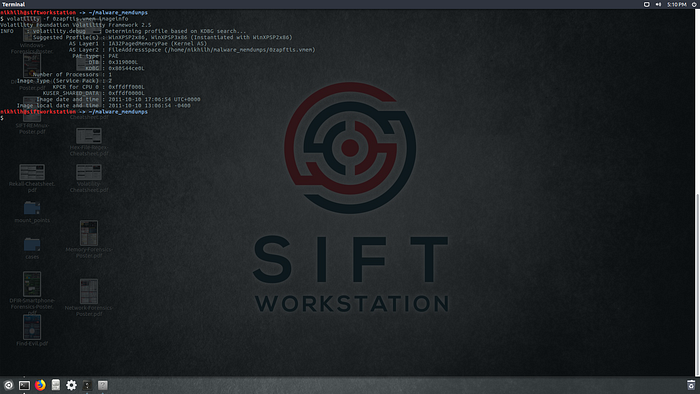
From the above details, we can see that the memory dump was taken on 2011–10–10 17:06:54 UTC. Also, we’ll use the WinXPSP2x86 profile since volatility suggests so.
Which processes were running at the time?
To determine which processes were running when the memory dump was taken, we’ll use the pstree and psxview plugins.
The pstree plugin displays the running processes in a parent-child structure. Alternatively, you can also use the pslist plugin (does not display the parent-child structure).

On first look, the process reader_sl.exe with PID 228 seems out of place because I’ve never heard of that process. However, it is too soon to draw conclusions.
The psxview plugin can be used to find those processes which are trying to hide themselves.

In this instance, we can see that there are no hidden processes. If there were hidden processes, the corresponding attribute in the pslist or psscan columns would be False.
What was the network activity at the time?
To determine the network activity at the time when the memory dump was taken, we’ll use the plugins connscan and sockets. (Another plugin, netscan also exists but it cannot be used in this case because of incompatibility with the profile.)
The connscan plugin scans the image for TCP connections. However, these connections are not guaranteed to be active. The sockets plugin prints a list of open sockets.

From the above information, we can see that a process with PID 1956 is communicating with a remote address, 172.16.98.1:6666 on port 1026.
Referring to the process list that we had enumerated before, we know that the process with PID 1956 is explorer.exe and reader_sl.exe is a child of explorer.exe. At this point, reader_sl.exe is definitely a suspect.
What commands were run?
To determine which commands were run (command line, process targets, etc.), we will use the plugins: cmdscan, cmdline and consoles.
From the cmdscan command reference page of volatility, “The cmdscan plugin searches the memory of csrss.exe on XP/2003/Vista/2008 and conhost.exe on Windows 7 for commands that attackers entered through a console shell (cmd.exe).”
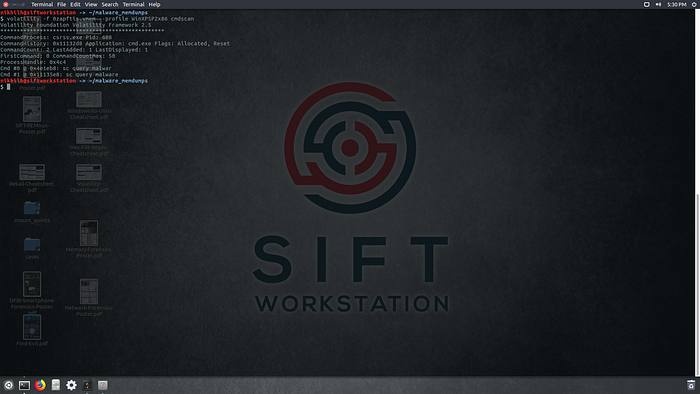
From the above information, we can see that two commands: sc query malwar and sc query malware were run on the console. The first command sc query malwar may have just been a typo mistake. It seems like the attacker / user was searching for a service named malwar or malware. This feels like a command that would be used by:
- an analyst searching for malicious services, or
- an attacker to verify that the malicious service was running.
The cmdline plugin provides process command-line arguments, i.e., the complete command which was used to launch each process.
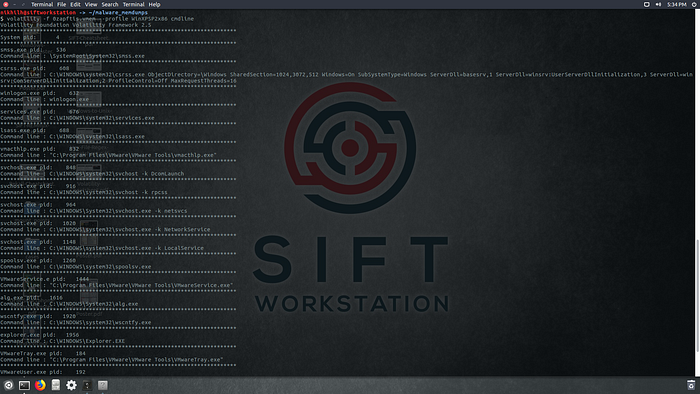
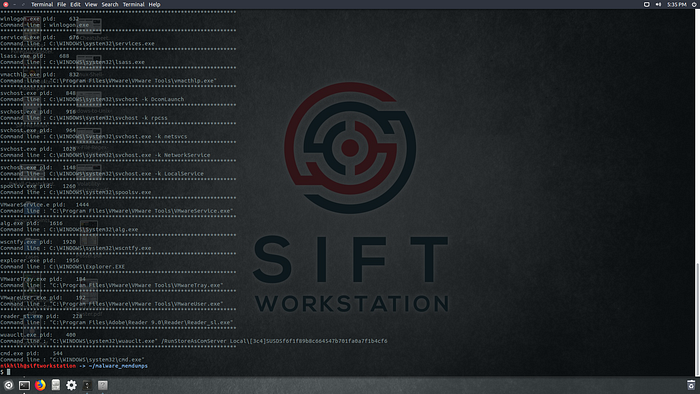
From the above information, we can see the full path of the suspect, reader_sl.exe process: “C:\Program Files\Adobe\Reader 9.0\Reader\Reader_sl.exe”. We also know now that it was launched with no arguments.
The consoles plugin is similar to cmdscan except that it prints the output of the commands as well. From the consoles command reference page of volatility, “Similar to cmdscan the consoles plugin finds commands that attackers typed into cmd.exe or executed via backdoors. However, instead of scanning for COMMAND_HISTORY, this plugin scans for CONSOLE_INFORMATION.”
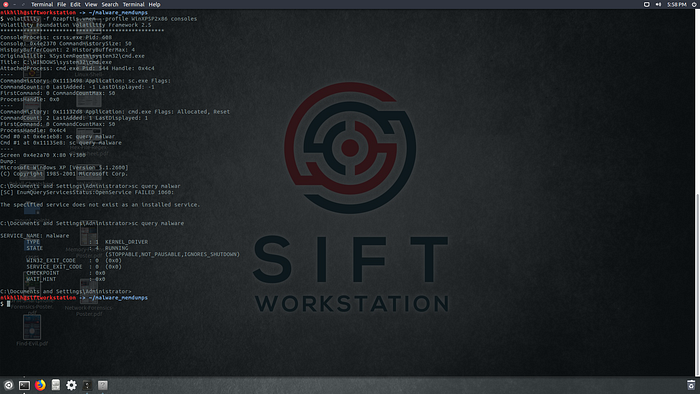
From the above information, we can see that there is a running service named malware which is of type, KERNEL_DRIVER. It means that the service is running in kernel mode and a malicious driver in the kernel does not bode good.
What can we understand from the suspect process?
It is possible to dump the suspect process memory and the executable using the plugins, memdump and procdump respectively.

The next step would be to search the suspect process’ memory and executable file for the string, 172.16.98.1 which was the remote IP address being contacted.
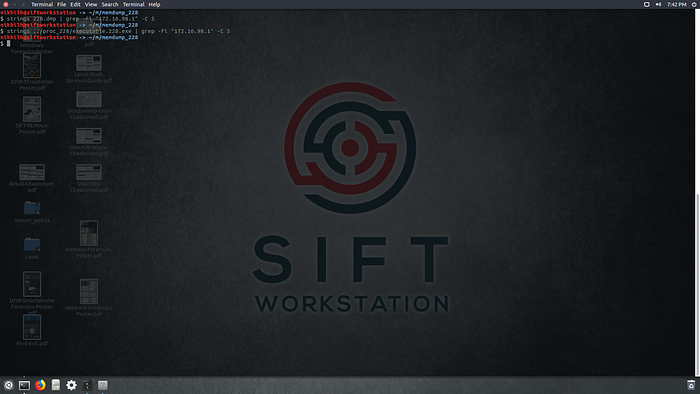
From the above information, we can see that there is no reference to the remote IP address. This can mean two things:
- The suspect process is innocent, or
- The suspect process contains encrypted information.
Let’s search for the string, malware (which was the name of the kernel service).
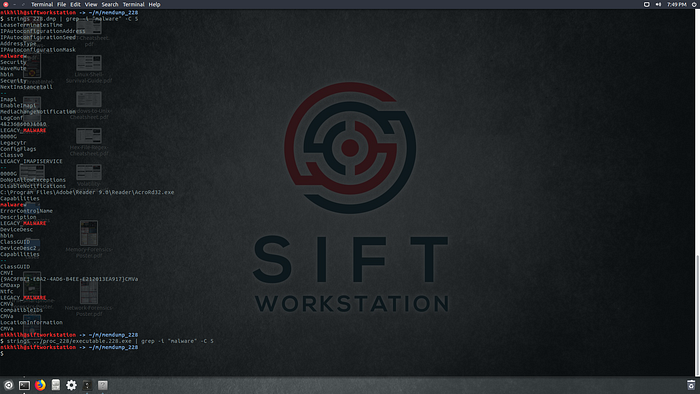
Aha! There are lots of references to strings containing malware. With this information, we can say with a fair degree of confidence that reader_sl.exe is likely malicious.
VirusTotal
At this point, we have an executable, reader_sl.exe which we consider malicious. There are two ways to proceed:
- Reverse engineer the malware executable, or
- Automated analysis with VirusTotal.
Usually, it is best practice to not directly upload the malware sample to VirusTotal. This is because the sample may contain sensitive information related to your organization such as usernames, passwords, etc. So, we’ll check the hash of the executable and see if we can get any hits from AVs.

This is quite astonishing! None of the AVs detected reader_sl.exe MD5sum as malicious. The only option available to us now is to manually reverse engineer the executable but that is outside the scope of this article.
Thanks for reading!
In this article, we looked at a procedure that can be followed to analyze a memory dump of a system. However, keep in mind that there are other plugins of volatility that can be used to answer various other questions.
Thank you for reading! If you have any questions, leave them in the comments section below and I’ll get back to you as soon as I can!
